 Sound is not a transverse wave
Sound waves exist as variations of pressure in a medium such as air. They are created by the vibration of an object, which causes the air surrounding it to vibrate. The vibrating air then causes the human eardrum to vibrate, which the brain interprets as sound.
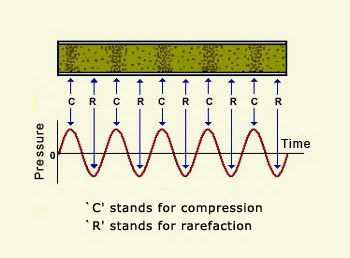
A sound wave arises because of a repeating pattern of high-pressure and low-pressure regions moving through a medium. It is sometimes referred to as a pressure wave. If a detector were used to detect a sound wave, it would discover fluctuations in pressure. At one instant in time, the detector would detect a high pressure, this would correspond to the arrival of a compression. At the next instant in time, the detector might detect normal pressure. Lastly, a low pressure would be detected, corresponding to the arrival of a rarefaction.
We can plot the pressure variation versus horizontal distance and it would look sinusoidal. The crests of the sine curve correspond to compressions; the troughs correspond to rarefactions and the "zero point" corresponds to the pressure that the air would have if no disturbances were moving through it. The adjacent diagram depicts the correspondence between the longitudinal nature of a sound wave and the pressure-time fluctuations, which it creates.
Similarly, displacements of particles about the mean positions and their speed about their mean position can also be plotted against horizontal displacement. And the plots again will be sinusoidal. (Please do not conclude that sound is a transverse wave which has crests and troughs! As sound passes through a medium, the particles of that medium do not vibrate transversely).