 Boiling point
 is the temperature at which the vapor pressure of liquid equals the pressure of atmosphere.
At that temperature, the vapor pressure of the liquid becomes sufficient to overcome atmospheric pressure and allow bubbles of
vapor to form inside the bulk of the liquid.
Boiling point
Boiling point is the temperature at which the vapor pressure of liquid equals the pressure of atmosphere.
At that temperature, the vapor pressure of the liquid becomes sufficient to overcome atmospheric pressure and allow bubbles of
vapor to form inside the bulk of the liquid.
 A liquid at its boiling point
The pressure of the vapor within a bubble in a boiling liquid pushes the liquid aside against the
opposing pressure of the atmosphere. Bubbles can't form unless the vapor pressure of the liquid is at least equal to
atmospheric pressure.
A liquid at its boiling point
The pressure of the vapor within a bubble in a boiling liquid pushes the liquid aside against the
opposing pressure of the atmosphere. Bubbles can't form unless the vapor pressure of the liquid is at least equal to
atmospheric pressure.
When a liquid is heated, it eventually reaches a temperature at which the vapor pressure is large enough that bubbles of vapor form inside the body of the liquid. This temperature is called the boiling point.
The normal boiling point of water is 100°C because this is the temperature at which the vapor pressure of water is 760 mm of Hg, or 1 atm. At 10,000 feet above sea level, the pressure of the atmosphere is only 526 mm of Hg.
Pressure cookers are equipped with a valve that lets gas escape when the pressure inside the pot exceeds some fixed value. This valve is often set at 15 psi, which means that the water vapor inside the pot must reach a pressure of 2 atm before it can escape. Because water doesn't reach a vapor pressure of 2 atm until the temperature is 120°C, it boils in this container at 120°C.
 Effect of intermolecular attractions on boiling
Boiling points of hydrides of IVA, VA, VIA and VIIA groups deviate from normal trend as they are involved
in hydrogen bonding. More heat is required for them to produce bubbles of vapor inside the liquid.
Effect of intermolecular attractions on boiling
Boiling points of hydrides of IVA, VA, VIA and VIIA groups deviate from normal trend as they are involved
in hydrogen bonding. More heat is required for them to produce bubbles of vapor inside the liquid.
Effect of intermolecular
attractions on boiling point:
Boiling point is a property whose value depends on the strengths
of intermolecular attractions in a liquid. When the attractions
are strong the liquid has a low vapor pressure. Hence
it must be heated to a high temperature to bring its
vapor pressure up to atmospheric pressure. Thus,
high boiling points are a result of strong intermolecular
attractions. We often use normal boiling point data to
assess relative intermolecular attractions among different liquids.
We notice that, there is gradual increase in boiling point for the hydrogen compounds of the group IVA elements (CH4 to GeH4). These compounds are composed of non polar tetrahedral molecules. The boiling points increase from CH4 to GeH4 simply because the molecules become larger and their electron clouds become more polarizable, which leads to an increase in the strength of dipole forces.
Similar is the case of hydrogen compounds of the other non–metals from period 3 to period 5. Thus, for three compounds of the Group V A series, PH3, AsH3 and SbH3, there is a gradual increase in the boiling point, corresponding again to the increase in strength of intermolecular attractions. Similarly, the boiling points increase for the three Group VII A compounds (HCl, HBr and HI). The period 2 members of each of these series (NH3, H2O and HF) have much higher boiling points observed as they are involved in the hydrogen bonding which is the strongest of all the intermolecular forces.
 Heating curve
The above shown graph is a heating curve observed when heat is added to a substance at constant rate.
The temperatures corresponding to flat portions of the curve occur at the melting point and boiling point.
Super heating is shown as continued heating beyond the boiling point.
Heating curve
The above shown graph is a heating curve observed when heat is added to a substance at constant rate.
The temperatures corresponding to flat portions of the curve occur at the melting point and boiling point.
Super heating is shown as continued heating beyond the boiling point.
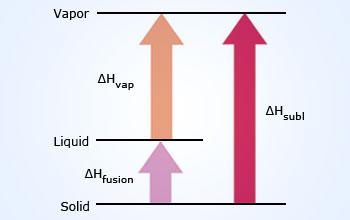
Energy changes occurring during the change of states:
As molecules in solids are most tightly bound
and that of gas are least bound so, more energy is
required to change the states from solid to liquid
and to gas, which means that the potential energy increases
from gas to liquid to solid i.e., solids have highest potential energy.
Heating curve:
A heating curve is observed when heat is added to a substrate
at a constant rate. When we study the adjacent graph, we
can find some interesting things about the energy changes
occurring. The portion of the graph with increase in slope
occur when there is an increase in the temperature of a solid,
liquid and gas phases. As the temperature is related to average
kinetic energy, nearly all of the heat we add in these regions
of heating curve goes to increase the average kinetic energy of
the particles. In other words, the added heat makes the particles
to move faster and collide with each other with more force. These
portions of rising slope will have units of degrees Celsius per joule.
This is the reciprocal of the heat capacity, meaning greater the slope,
lower the heat capacity. Gases have low heat capacities than
liquids and solids. Therefore heating of gas has largest slope.
 cooling curve
A cooling curve is observed when heat is removed from the substance at constant rate. Condensation of
vapor to a liquid occurs at same temperature as the liquid boils. Super cooling is seen here as the temperature of liquid
decreases below its freezing point. Once a tiny crystal forms, the temperature rises to the freezing point.
cooling curve
A cooling curve is observed when heat is removed from the substance at constant rate. Condensation of
vapor to a liquid occurs at same temperature as the liquid boils. Super cooling is seen here as the temperature of liquid
decreases below its freezing point. Once a tiny crystal forms, the temperature rises to the freezing point.
Cooling curve:
Cooling is the process which is exactly reverse to the heating.
Here the slopes are downward when there is decrease in temperature
and there is a flat region when there is a change in state of matter.
When we closely observe both the given adjacent curves we find blips on heating curve near transition from liquid to gas and on cooling curve when a liquid is cooled to a solid. This represents the process of super heating and super cooling respectively. Super heating occurs when liquid is heated above the boiling point without boiling. If disturbed, a super heated liquid will erupt with a shower of vapor and liquid.
When cooling a liquid it is possible to decrease the temperature below the freezing point without solidification creating a super cooled liquid. Once the super cooled liquid is disturbed very rapid crystallization occurs. The important application of super cooling is that super heating liquid provides instant heat source for minor injuries since the crystallization process evolves large quantities of heat.
Heat Of Vaporization:
The heat of vaporization is the energy needed to convert
1gm of liquid into 1gm of gas at a temperature equal
to the normal boiling point of the liquid. The units
for the heat of vaporization are joules per gram (
Jg−1). If 1 mole of liquid is vaporized, we call
the energy the molar heat of vaporization and we use the units
joules per mole(J mol−1). In either case
the symbol is ΔHvap. Since energy must
always be added to a liquid to cause it to vaporize,
ΔHvap is always positive. In thermodynamics a
positive ΔHvap is defined as indicating an
endothermic process. The reverse process, condensation,
requires the gas to give off heat in an exothermic process.
Since vaporization and condensation describe the same process
from different directions, their heats are related by the equation
ΔHvap = − ΔHcond.
There are differences in the heats of vaporization that can be related to the intermolecular attractive forces. For similar size molecules, hydrogen bonded substances have the largest ΔHvap values.